As the holiday shopping season reaches its peak, ecommerce business owners everywhere are crossing their fingers, hoping they have enough product in stock and that they didn’t order too much. In a few short weeks they’ll find out just how accurate their demand forecasting method was.
In truth, demand forecasting, or estimating how much product you’ll sell in the future, is one of the toughest challenges for any ecommerce business. There are so many variables, and so many internal and external factors to take into consideration that no single method is going to work for every product and every business. Furthermore, no method is 100% accurate. No matter how you forecast demand, it’s still going to be an estimate — yes, it’s an educated guess, but it’s still a guess!
Today we’re going to peer into the crystal ball of demand forecasting and take some of the mystery (and stress!) out of the process.
What is Demand Forecasting?
Demand forecasting is the process of estimating how many units of each product you’ll need to cover demand for a given sales period, without running out of stock or having to take excessive post-holiday markdowns. The process usually includes analyzing historical data for seasonal trends and product performance, as well as gathering current data on competitors, marketplace trends, future marketing plans and promotions. While it sounds intense, the objective is not 100% accuracy, but to get as close as you can to an acceptable level of inaccuracy.
Sales forecasting is often confused with demand forecasting, so it’s worth pointing out the differences between the two. Mainly, they differ by who’s doing the forecasting, and for what reasons. Sales forecasting is usually undertaken by finance and executive teams who are trying to predict revenue in order to create annual budgets and make strategic decisions about hiring, marketing, and expansion.
Demand forecasting has more to do with consumer interest in your product, trends in the marketplace, and how these and other factors could affect your future day-to-day operations. For an ecommerce business, demand forecasting strongly influences inventory management and fulfillment operations, but those aren’t the only reasons:
- Maintain a healthy cash flow
- Launch new products
- Develop pricing strategies
- Prep fulfillment centers for high-volume periods
- Account for production lead times
- Minimize the effects of supply chain issues
- Optimize warehouse distribution
- Prevent lost revenue caused by stockouts
- Reduce inventory costs
- Quickly react to external forces
It’s All About the Data
There are many ways to predict demand. All of them rely on data, whether you’re using historical data or new findings gathered from consumer research. There are two kinds of data that can help with demand forecasting: quantitative data and qualitative data.
Quantitative data is numerical data, usually historical sales data. Established companies will have years and years of quantitative data to work with, enabling them to identify trends and better understand the effects that marketing campaigns, pricing, seasonality, and other factors have on their merchandise.
Qualitative data is more subjective. This type of data must be actively gathered by researching market trends, analyzing the competitive landscape, conducting consumer surveys and focus groups. Younger companies that don’t have a lot of quantitative data to draw from must rely on qualitative data to forecast demand. Many established companies also use qualitative data to get a more nuanced view of consumer demand than they can get from qualitative data alone.
As the old “garbage in, garbage out” adage warns, your forecast is only as accurate as the data you input. Accurate data forecasting requires accurate data, robust data analysis tools, and people who understand how to use them.
A powerful order and inventory management system can track inventory levels in real time, help identify short and long-term trends, automate critical re-order points, optimize order size and cadence, generate customized reports and so, so much more. If your fulfillment center can’t generate the historical data you need, that’s the first place to start. Look for a tech-first 3PL that understands the importance of real-time transparency and easily accessible data that gives you the big picture as well as the granular details.
If you’re collecting qualitative data, make sure you’re using proper research methodology to ensure the reliability of the data you’re collecting.
Establish Your Objectives
Once you have the data, what do you do with it? Well, you can do as much or as little as you like! Even a basic spreadsheet should be able to help you identify seasonal fluctuations and fast or slow-moving SKUs. Creating graphs and pie charts out of your numerical data can make it easier to spot trends and gain insights. Layering in qualitative data will give you even more colorful results and valuable insights.
Of course, the more data you need and the more sophisticated your methods are, the more expensive demand forecasting becomes. If you’re not careful, the costs of forecasting can outweigh the potential savings in inventory costs. That’s why it’s important to understand exactly what you’re trying to achieve, and how accurate the data needs to be before choosing a method.
In general, start with the method that offers the best use of available data. If that gives you a reasonably accurate estimate, no need to spend more. The amount of data available usually depends on the maturity of the product. For example, if you’re introducing a new product and there are no similar products to draw historical data from, qualitative research is a must to reduce risk. A more mature product may not need qualitative research at all, or only occasionally to test a promotion for example.
In production and inventory control, the more accurate your demand forecast, the less safety stock you’ll need to carry in inventory. If you know how much your inventory costs to store, per unit, you can determine whether or not a more expensive forecasting technique is worth the potential savings in inventory costs. Your fulfillment center or 3PL should be able to give you this cost or make it easy to find in a few clicks.
Demand Forecasting Methods
When it comes to optimizing inventory and fulfillment operations, the primary objectives of demand forecasting are to:
- Prevent lost revenue and reduce customer frustration from stockouts
- Prepare fulfillment operations for spikes in order volume
- Minimize inventory carrying costs
- Minimize markdowns
There are three basic methods of forecasting, and several models and techniques within each method. Your choice might depend on where the product is in its growth cycle, how far into the future you’re forecasting, your budget, and how accurate the forecast needs to be.
Time Series Forecasting Models
Time series forecasting methods are statistical techniques used when you have several years of historical data about the product or product line, and external forces and trends are relatively stable. This technique compares data from the same points in time over several years, searching for patterns and watching for changes in those patterns. It can be used to predict long-term trends or short-term (seasonal) demand, depending on the model you use. Because time-series models use data that is already available, they are the least expensive forecasting methods.
Some examples of time series forecasting models include:
- Moving average
- Exponential smoothing
- Box-Jenkins model
- X-11
- Trend projections
Qualitative Forecasting Models
Qualitative methods are used for new product development and testing, and for older products to quantify the effects of a promotion or price change, or to evaluate expansion plans. Various methods are used to collect qualitative data and convert it into quantitative estimates. Qualitative forecasting methods tend to be more expensive than time-series methods, but can reveal insights you might not get from studying numbers.
Some examples of qualitative forecasting models include:
- Delphi method
- Market research
- Panel consensus
- Historical analysis
- Visionary forecast
Causal forecasting models analyze the relationships between historical performance and external forces in the broader economy. Such forces might include supply chain issues, a recession, a new competitor in the marketplace, or a global event such as the Olympics. Causal models are used to forecast sales, predict turning points in growth trends, track consumer attitudes, and determine what must happen to create the desired output. Causal forecasting models are among the most expensive to implement and require several years’ worth of historical data.
Some examples of causal models include:
- Regression models
- Econometric models
- Intention-to-buy & anticipations surveys
- Input-output models
- Diffusion index
- Life-cycle analysis
How to Use Demand Forecasting to Optimize Operations
Here are the main steps to demand forecasting, when using it to optimize ecommerce fulfillment operations and inventory control:
1. Analyze past and current sales trends. Apply those trends to forecast future sales, whether 30 days, 90 days, or 12 months. Always compare apples to apples. Compare the same product and the same time period from year to year, whether it’s the same quarter, month or day.
2. Adjust for variations. What promotions did you have running during that time period? What promotions do you have planned for this year? How many shopping days were there between Thanksgiving and Christmas last year vs. this year? Any unusual events that might have skewed your numbers last year that you can probably rule out this year?
3. Calculate average daily sales for each SKU.
Total Units Sold last year / 365 = Average Daily Sales
4. Calculate lead time demand. That’s the number of units you need to have on hand to avoid running out before the next order comes in.
Average Lead Time X Average Daily Sales = Lead Time Demand
If you sell an average of 5 black wool beanies per day, and it takes 30 days to restock, you need at least 150 black wool beanies in stock at all times.
5. Calculate safety stock. This is the number of units you need to keep on hand to cover yourself in a worst-case scenario (high demand + shipping delay). What are the most units you’ve ever sold in a day? What is the maximum number of days it could take to restock?
Maximum Daily Sales X Maximum Lead Time (in days) – Lead Time Demand = Safety Stock
If the most beanies you’ve ever sold in one day is 12, and the longest it’s ever taken to restock them was 35 days, then you’d need 270 units of safety stock: 12 x 35 – 150 = 270
6. Set reorder points. A reorder point is the point at which the inventory level for a particular product falls below the quantity necessary to maintain adequate lead time demand and safety stock.
Lead Time Demand + Safety Stock = Reorder Point
7. Adjust as needed. Demand forecasting is not a perfect science. Snow happens. Promotions fail. No matter what happens, it’s important to maintain a high level of customer service and learn from your mistakes. The data you create this year will inform your projections for next year.
Need Help?
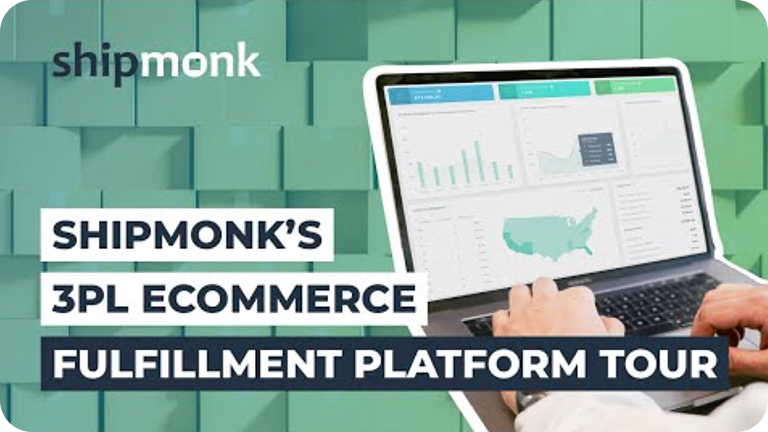
ShipMonk tracks orders, inventory levels and costs for hundreds of ecommerce businesses as we go about picking and packing thousands of orders per day across 12 global fulfillment centers. Real-time data is centralized and available 24/7 through a single software portal, giving you complete transparency into your fulfillment operations. Customized reports can be created to help you track sales trends and make informed, data-driven business decisions.
Keep reading our blog for a deeper look at some of the forecasting models and techniques mentioned above. Take a quick tour of one of our automated warehouses, or schedule a demo of our industry-leading order and inventory management system. We’d love to show you how easy demand forecasting can be when you have the right tools and the right team on your side!


